Value stream & lead time
The value stream is the sequence of activities to deliver on a customer request — the dual flow of information and material. Manufacturing taught us how to measure it. The same metrics transfer cleanly to technology work.
Manufacturing
Technology
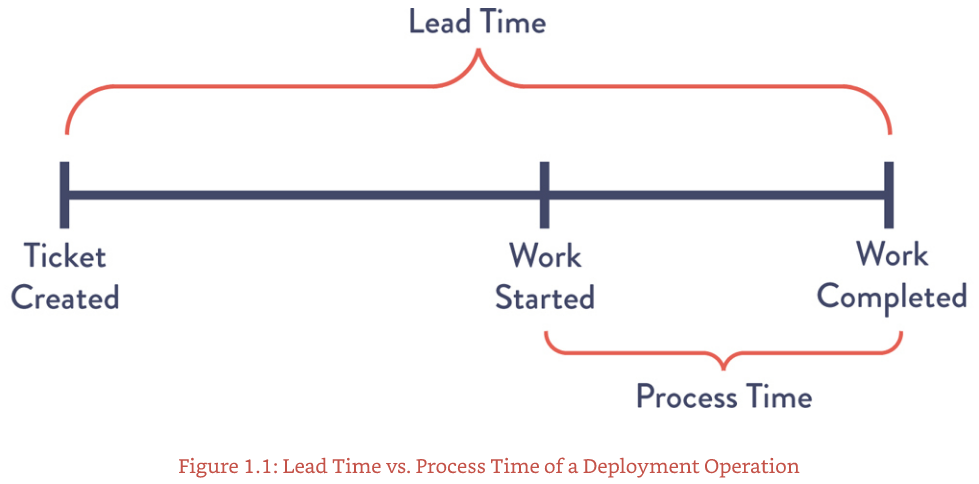
Lead Time is wall-clock — Ticket Created → Work Completed. Process Time is hands-on — Work Started → Work Completed. The gap is queue time, where most of the waste lives.
// ask: in your job, which is bigger — lead time or process time? almost always lead time. the improvement target is the gap.
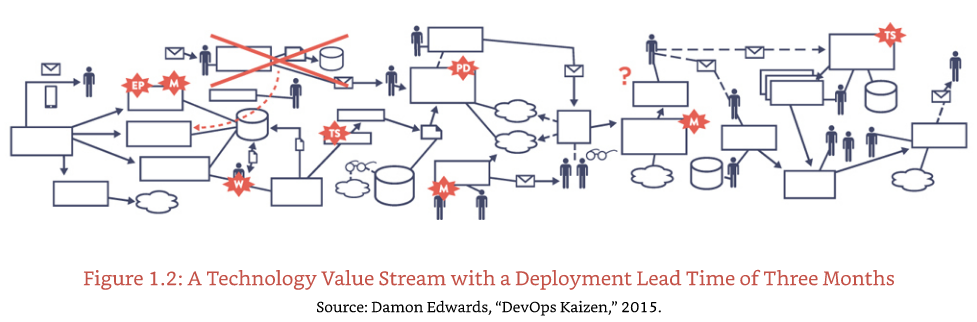
What you typically see when deployment lead times take months:
- — Nothing works at the end when you merge everyone's changes
- — Code that no longer builds correctly or passes tests
- — Days/weeks to figure out who broke what and how
- — Poor customer outcomes — features ship late or never
// this isn't a personnel problem. it's a system-design problem.
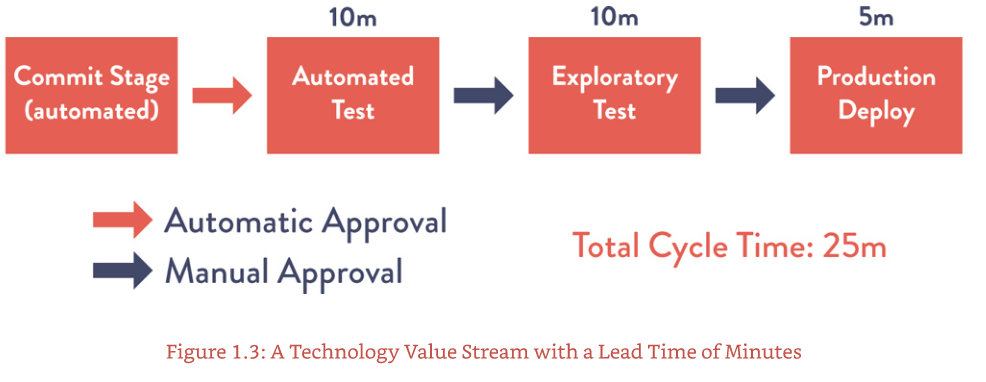
- — Modular architecture
- — Loosely coupled services
- — Well-encapsulated components
- — Automated test + deploy pipelines
- — Shared databases everyone writes to
- — Monoliths deployed atomically
- — Manual approval gates
- — Long-lived branches
Items completed per period — is value delivery accelerating?
Active work ÷ total elapsed — where are the queues?
Stakeholder pulls a unit of value through — is time-to-value shrinking?
Active + waiting items — demand vs capacity?
Mix of work types (features / defects / risks / debt) — adjusted to current need?
And one more — %C/A · Complete and Accurate %: at each step, what % of the time does the next step receive work that's "usable as-is"? No need to correct, add, or clarify. High %C/A is a leading indicator of low rework.
A team has fast process time per ticket but lead time is 3 weeks. What does this tell you?
// pick one to verify